
A statistical analysis tied to President Donald Trump’s 2024 vote share is fueling a new dispute over the reported 2026 midterm results, according to The Gateway Pundit.
The analysis comes from an X account identified as Truth Is Freedom. It claims a formula matched Republican performance across 673 of 692 U.S. counties. The account says states where Trump received less than roughly 58.5% in 2024 also fell below the 50% mark in governor and Senate races in 2026.
Texas, Kansas, Iowa, Ohio, South Carolina and North Carolina are presented as examples. The analysis says each followed that pattern and flipped to Democrats. That claim gives the argument a much bigger reach than a single close race: it describes a relationship repeated across states.
Truth Is Freedom’s model uses Trump’s 2024 state share as its starting point. It says Republicans retained about 85% of that share in Senate contests and about 86% in governor contests. Its stated formulas describe Republican 2026 performance as Trump’s 2024 result multiplied by 0.85, while the Democratic result combines Harris’s 2024 share with 15% of Trump’s share.
The Gateway Pundit says the pattern resembled an earlier “Drop and Roll” vote pattern it reported from the 2020 election. That earlier pattern, the report says, was never explained. On Monday, Truth Is Freedom released another chart showing county results that it says fit the same equation.
THE 15% BAND
Look at this chart.
59 races. Senate and governor.
States ordered from reddest to bluest in 2024.The solid lines are 2024.
The dashed lines are 2026.
The shaded bands are what moved.One formula fits all of it:
Republican 2026 = 0.85 × Trump 2024
Democrat… pic.twitter.com/9cnJ5bAY54— Truth Is Freedom (@TruthAnswersAll) November 6, 2026
The findings drew pushback from left-wing critics and other X users, according to the report. In response, Truth Is Freedom published a list of rebuttals. One objection said the relationship was merely an average. The team’s answer was that it had run a regression across 35 state checks, producing an R² value of 0.87.
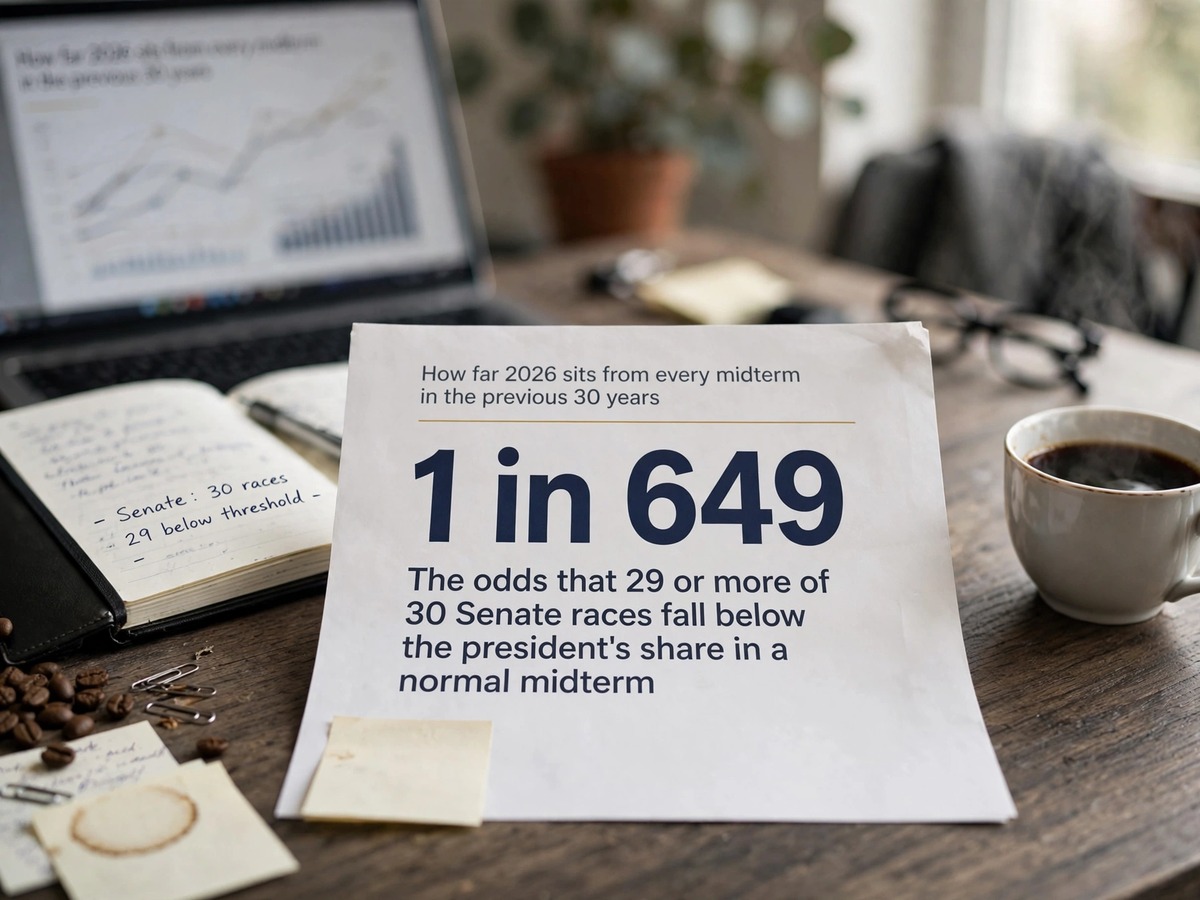
The team also cautioned that the fit alone is not the unusual part. It acknowledged that close relationships have appeared before, pointing to 2022 as another tight result. Its argument is that the combination is rare: an 85% Republican retention level, 29 of 30 Senate races falling below Trump’s share, and the same proportion appearing across states.
Using the statistical measure in plain language, the analysis says 0.87 means Trump’s 2024 performance in a state explains 87% of the state-to-state differences in Republican 2026 results once it is multiplied by 0.85. The remaining 13%, according to the explanation, covers factors such as candidates, campaigns, advertising and local issues. The account compares this to predicting students’ test scores from their previous grades, although the analogy is only meant to explain the strength of the relationship.
The historical comparison raises the stakes. Truth Is Freedom calls the Republican drop the largest in any midterm since 1994. It also says the usual share of Senate races below Trump’s prior performance is about 70%, with the previous high at 84%. Those comparisons are being used to argue that 2026 was not simply another election with a strong statistical fit.
Last night I said I know what this is.
Now I can call it what it is.The 15% Diversion.
The attacks are coming, but just like the truth, the math is solid.
Here are answers to some of the false criticisms we may all be hearing. pic.twitter.com/cwEiiDPRaA
— Truth Is Freedom (@TruthAnswersAll) November 11, 2026
Why It Matters
This matters because the claim reaches beyond a dispute over one candidate’s margin. It argues that one relationship tied to Trump’s earlier vote share accounts for much of the difference in Republican results from state to state. If that reading holds, it would challenge the normal expectation that candidates, campaigns, local issues and advertising produce more varied outcomes. Voters are affected because confidence in reported totals influences how they understand the result. Candidates and campaigns are affected because the explanation assigns far more weight to the prior presidential vote than to their own messages or local work.
Still, a close statistical relationship does not by itself identify a cause. The account’s case depends on the quality of the underlying county and state data, the way the shares were calculated, and whether other explanations can account for the same pattern. That leaves a clear open question for anyone evaluating the allegation: does the relationship remain persuasive when the method is independently checked? Supporters can view the repeated alignment as an extraordinary signal, while critics can say correlation is not proof of wrongdoing. The larger issue is trust, because a disputed pattern can influence how voters judge the election even before its cause is settled.
Finally, The Gateway Pundit says Truth Is Freedom provided it with a privileged report assessing the legitimacy of the 2026 midterm numbers. The report put the odds that the results were legitimate at 1 in 649, or 0.15%, and described that outcome as nearly impossible. That estimate is the most sweeping claim in the analysis, and it is now the point at which a statistical argument becomes a direct challenge to confidence in the reported results.
Source: The Gateway Pundit